


Table of Contents
◉ Introduction ◉ Core Concepts: What Each Cost Really Means ◉ Decision Framework ◉ Pricing & ROI ◉ Step-by-Step ◉ Mini Case Study ◉ Common Mistakes & How to Avoid Them ◉ Expert Tips & Power Moves ◉ Integration Landscape ◉ FAQs ◉ Conclusion
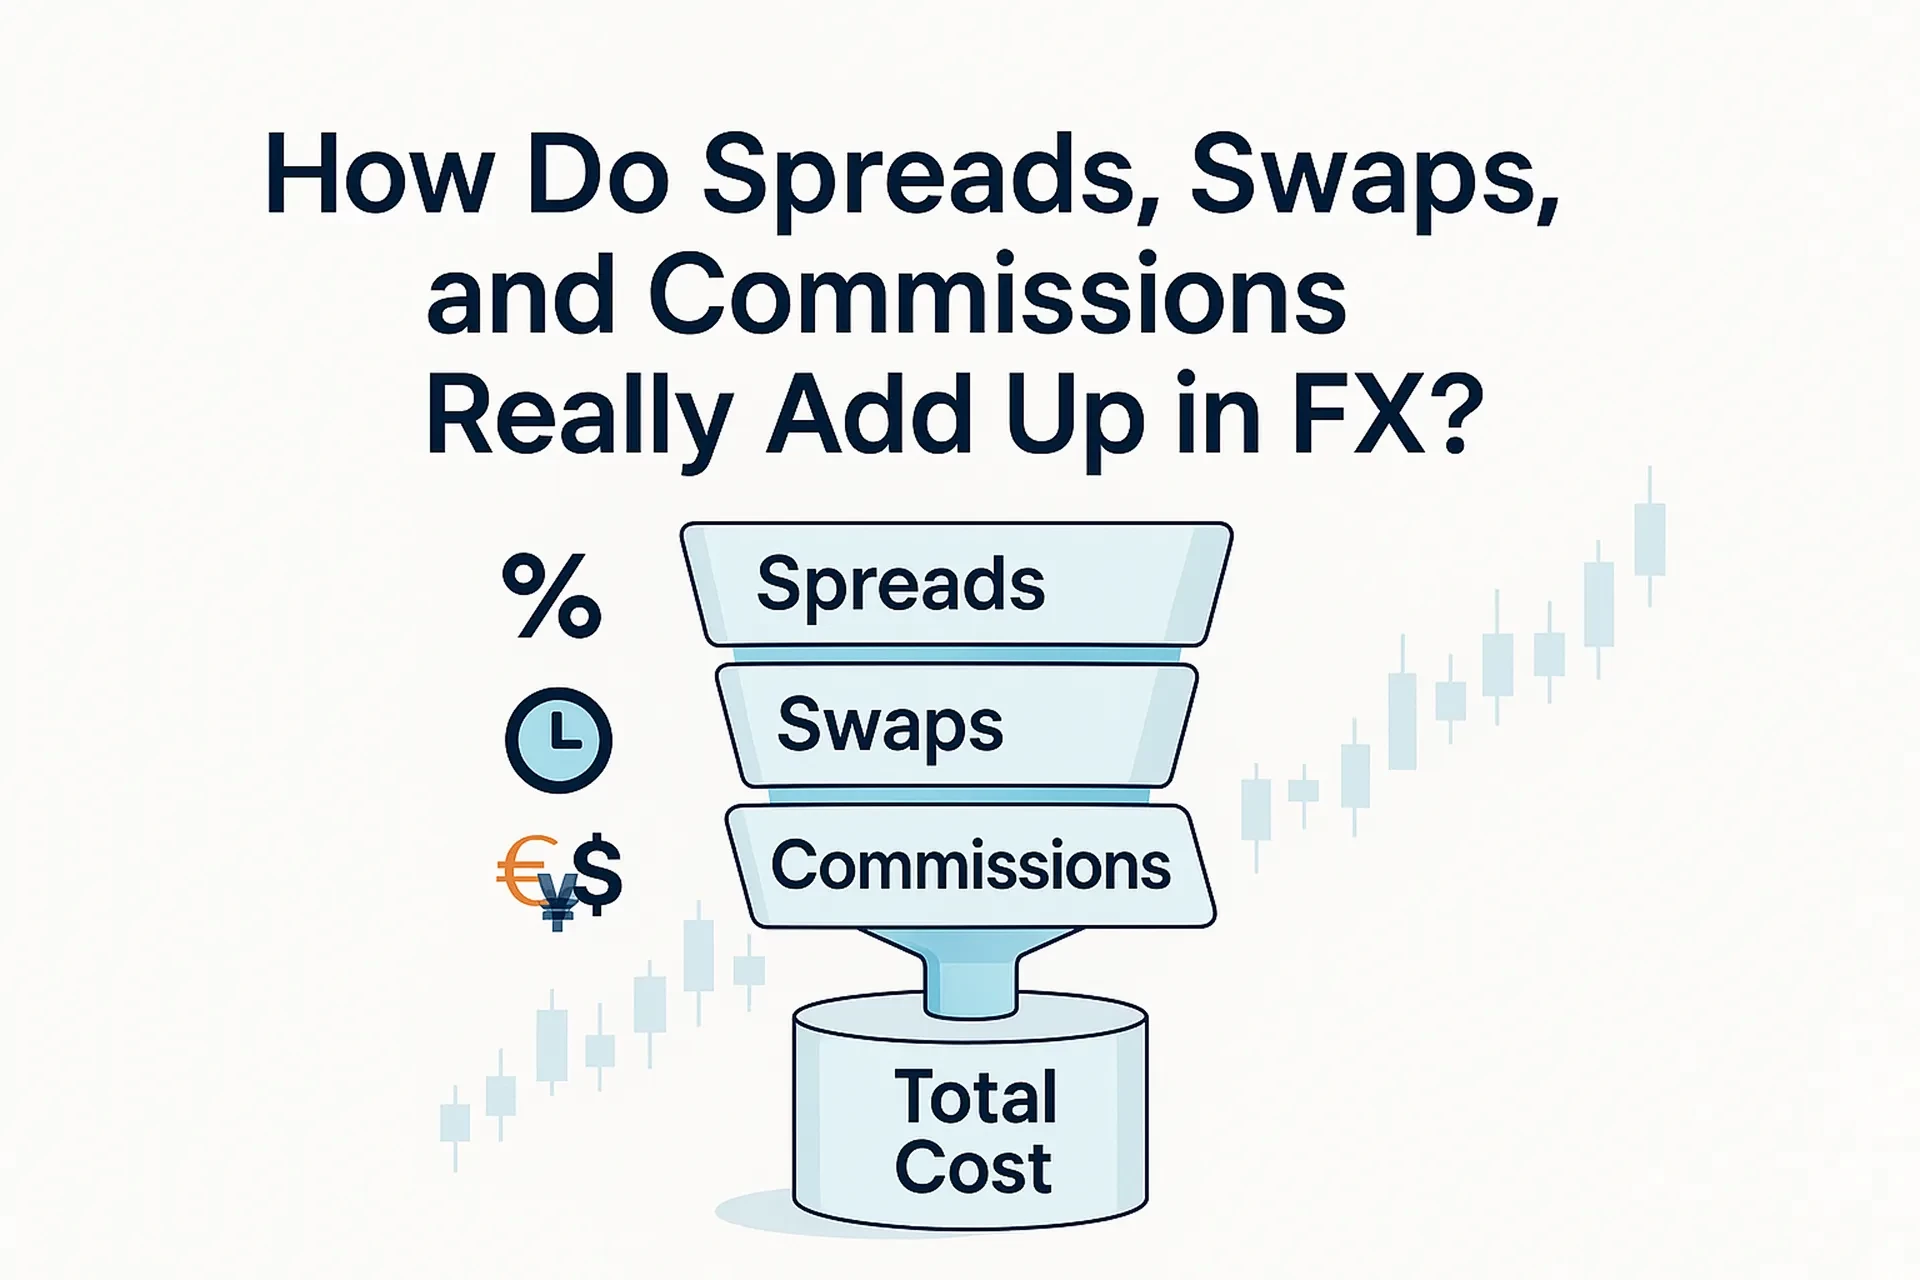
If you’ve ever looked at your FX statement and wondered why your P&L doesn’t perfectly track the chart, you’re not imagining things. In spot FX, three cost buckets quietly shape your outcomes: the spread (the gap between bid and ask), swaps/rollover (the financing you pay or earn when you hold past the market’s daily close), and commissions (explicit fees on some account types). Each bucket behaves differently across market conditions, account models, and holding periods—and the “true” all-in cost is the sum of all three, plus execution frictions like occasional slippage. In this guide, you’ll get a practical, U.S.-focused framework to calculate, compare, and reduce total FX trading costs—whether you scalp during New York/London overlap or swing positions through central-bank meetings. Where needed, we cite current industry sources, regulators, and market infrastructure so you can verify the details and apply them with confidence (BIS – Triennial FX Survey (2022); CLS – FX spot T+2 background (2024–2025); OANDA – Financing Fees explainer; FOREX.com – Rollover rates).
🏃♂️ Don’t have an FBS account yet?
Open an account and apply this all-in cost framework (spreads, swaps, commissions) in real time.
Open an FBS Account
Open an account and apply this all-in cost framework (spreads, swaps, commissions) in real time.
Open an FBS Account
Core Concepts: What Each Cost Really Means
Spread (implicit cost).
Every quote shows a bid (sell) and ask (buy). You “cross” that gap whenever you enter or exit at market—this is the spread you pay. Narrower spreads usually appear in liquid sessions; wider spreads show up during news or thin hours. For retail FX, spread is an embedded transaction cost and a real component of your breakeven distance (IG – Understanding forex spreads). For general definitions, see reference primers on bid/ask mechanics (Investopedia – Bid/Ask).
Swaps / Rollover (financing).
Hold a position past the market “end of day” (commonly 5:00 p.m. ET) and your broker applies a financing charge or credit based on the interest rate differential between the two currencies and the notional of your position. Because FX spot settles T+2, the Wednesday rollover typically covers three days to account for the weekend (“triple-swap Wednesday”) (OANDA – Financing & triple-day notes; CLS – FX spot T+2 is the de-facto standard; see also FOREX.com – Rollover rates). The pricing logic mirrors covered interest parity used in forwards and FX futures (CME – FX futures pricing and basis).
Commissions (explicit cost).
“Raw spread / ECN” accounts often charge a per-notional commission with very tight spreads; “spread-only” accounts widen the spread instead. For example, commission-based agency execution at large multi-dealer aggregators is often quoted in a range of ~$16–$40 per $1 million round turn (varies by broker, tier, and venue) (ForexBrokers – IBKR forex review (2025)). Brokers publish schedules and risk disclosures you should read carefully (IBKR – Spot currencies commissions).
Why it matters now.
Liquidity conditions, policy cycles, and settlement practices affect costs at the margin. The BIS’s latest published triennial snapshot (April 2022) showed $7.5T/day turnover and FX swaps as the largest instrument share (BIS – OTC FX turnover (2022)). Trade press indicates 2025 survey updates point to higher daily turnover and shifting instrument mix; treat such summaries as directional until you review the BIS release details yourself (FX-Markets – 2025 coverage).
Decision Framework: Pick the Right Pricing Model for Your Style
Use this quick checklist to choose between spread-only and raw-spread + commission accounts and to anticipate your swap exposure.
If you scalp/intraday (seconds to minutes):
• Prioritize raw spread + low commission; your edge lives in ticks, so every tenth of a pip matters.
• Trade during London–New York overlap to access tighter spreads and deeper liquidity (IG – Low-spread sessions).
• Avoid holding past 5:00 p.m. ET: swaps can dwarf micro-profits on very short holds (OANDA – Daily financing cutoff).
If you day trade (minutes to hours, flat by EOD):
• Either model can work—compare all-in effective spread after commission vs. spread-only.
• Use limit orders to avoid crossing wide quotes during volatility spikes; slippage is a real but hard-to-measure implicit cost (FCA consultation notes on implicit costs, 2025).
If you swing trade (multi-day/weekly):
• Model swap carry explicitly. You might earn carry on some longs/shorts—or pay meaningfully on the other side. Rate differentials can change as policy shifts. Brokers publish daily indicative rates and formulas (FOREX.com – Rollover rates & notes; OANDA – Financing formula example).
If you hedge/overlay for a portfolio:
• Compare OTC spot costs with listed futures (transparent tick sizes, no overnight swap, but initial/variation margin and basis to spot) and with forwards aligned to settlement needs (CME – Pricing & basis; BIS – Settlement risk note).
Pricing & ROI: Turning Quotes Into Dollars and Pips
Here’s a practical way to translate quotes into comparable numbers:
1) Effective spread (in pips and $).
• Take the displayed spread in pips.
• If your account charges commission, convert the per-side commission to pips on your notional and add it to the raw spread to get an effective spread. As a rough anchor for commission-based models, many agency brokers land in the $16–$40 per $1M round turn range (≈ 0.16–0.40 pips on EUR/USD at $10 per pip per standard lot) (ForexBrokers – IBKR 2025).
2) Swap/rollover (daily).
• Brokers typically compute: Daily financing = Notional × Price × Funding rate ÷ 365, with long/short rates posted per instrument and applied at 5:00 p.m. ET. Wednesday often carries 3× to include the weekend because of T+2 settlement conventions (OANDA – Financing formula & triple-day; CLS – T+2 background).
• Expect exceptions around market holidays; brokers disclose when financing covers more than one day (FOREX.com – Rollover notes).
3) Slippage (occasional).
• Slippage turns into an implicit spread when your fills deviate from the quote—common around data releases or thin liquidity. Regulators have flagged that “implicit transaction costs” can be imprecise to measure, so treat your own historical slippage as the best estimate (FCA – Implicit cost discussion, 2025).
Example: One standard lot EUR/USD, raw+commission vs spread-only
| Scenario | Quote/Fees | Your action | Cost math (illustrative) | Net impact |
|---|---|---|---|---|
| Raw spread + commission | 0.2-pip raw spread; $20 per $1M round turn commission | Buy then sell 1 lot | Effective spread ≈ 0.2 pips + 0.2 pips commission ≈ 0.4 pips total | You need ≥0.4 pips to break even ignoring swaps |
| Spread-only | 0.8-pip spread; no commission | Buy then sell 1 lot | Effective spread ≈ 0.8 pips | You need ≥0.8 pips to break even ignoring swaps |
Notes: Commission rates vary by broker/volume; numbers above are illustrative. See published schedules and independent reviews for ranges (IBKR schedule; ForexBrokers – IBKR 2025).

Cut Your All-In Trading Costs with an FBS Account
Choose between raw + commission or spread-only accounts, check daily swaps (5:00 p.m. ET cutoff), and optimize execution for scalping, day trading, or swing—aligned with this article’s framework.
Open an FBS AccountStep-by-Step: Compute Your All-In Cost Before You Click
Step 1 — Record the live spread.
• Quote panel shows bid/ask; note the spread in pips. During liquid hours, majors can be a fraction of a pip; off-hours/news can be multiple pips (IG – Spreads & sessions).
Step 2 — Convert commissions to pips.
• Commission $ per side ÷ $ per pip at your lot size = pips per side; double it for round turn. On EUR/USD, one standard lot ≈ $10 per pip.
Step 3 — Estimate expected slippage.
• Use your trade logs. If you average 0.1 pips adverse slippage per side around news, add ~0.2 pips to your effective spread for those trades.
Step 4 — Model swap for your intended hold.
• Fetch the broker’s long/short daily funding rate for your pair.
• Multiply using the broker’s formula and your planned days held. Remember triple Wednesday and holidays (OANDA – Financing formula, 5 p.m. ET; FOREX.com – Rollover rates).
Step 5 — Decide.
• If you seek sub-pip targets, raw+commission often wins. If you hold several days, swap dominates—favor pairs where you earn carry or consider forwards/futures for hedges (CME – Pricing & basis).
Mini Case Study: The Hidden Cost That Flipped a Trade
Setup. You plan to long USD/JPY for four days into a jobs report. Your account is raw+commission; effective spread computes to 0.45 pips.
What happened.
• Day 1 entry/exit crossing totaled 0.45 pips cost.
• You held through Wednesday, incurring triple-day rollover. Your long USD vs JPY earned carry at first—but a midweek broker update reflected rate moves, trimming the credit.
• Headline volatility added 0.2 pips average slippage per side.
Outcome. Net move was +0.6 pips, but after 0.45 pips spread+commission, 0.4 pips cumulative swap debit/credit (net), and 0.4 pips slippage, you finished -0.65 pips. The chart said “up,” but costs said “down.” This is typical when swaps flip or when triple-day rollover magnifies financing (OANDA – triple-day rationale; CLS – T+2).
Common Mistakes & How to Avoid Them
• Ignoring financing on multi-day holds. Even small daily rates compound—Wednesday matters. Check your broker’s daily sheet before committing capital (FOREX.com – Rollover transparency).
• Confusing “tight spreads” with “low total cost.” Raw quotes can look razor-thin, but commissions add up; always compute effective spread.
• Trading illiquid hours. Spreads can balloon around roll-over and during quiet Asia hours for some crosses—your breakeven distance expands (IG – Spreads vary with liquidity).
• Underestimating slippage. Around data releases, stops and markets fill away from the quote. Treat slippage as a probabilistic cost, informed by your logs and execution-quality reports (regulators note the difficulty of pinning precise implicit costs; see FCA discussion, 2025).
• Mismatching instrument to objective. If you need fixed expiry or accounting simplicity, futures or forwards might beat rolling spot (CME – Futures pricing/basis).
Expert Tips & Power Moves
• Trade the overlap. Your tightest spreads usually arrive during London–New York overlap; build your playbook around those windows for majors (IG – Low-spread sessions).
• Measure your broker, not the brochure. Export fills and compute realized spread + slippage. If your effective spread differs from advertised, talk to your broker or adjust order types.
• Watch central-bank calendars. Swaps reflect rate differentials; policy paths move your financing line item as much as your chart.
• Consider CLS/settlement context. Industry infrastructure and cut-offs influence when and how financing accrues, especially around holidays and the 5:00 p.m. ET turn (CLS – Settlement notes; Reuters – CLS & T+1 equities context (2024)).
• Benchmark against listed. For hedgers, compare the all-in cost of rolling spot vs. Micro FX futures (transparent fees, no daily swap; basis risk applies) (CME – Micro FX contract notes).
Integration Landscape: Data You Actually Need From Your Broker
To maintain an accurate cost-of-trading sheet, collect these data points directly from your broker’s portal or API:
• Per-pair long/short financing rates (annualized) and the daily cutoff time (commonly 5:00 p.m. ET) (OANDA – Financing, daily cutoff).
• Commission schedule by notional tier (if applicable), ideally as $ per $1M so you can convert to pips easily (IBKR – Spot currencies commissions).
• Execution-quality metrics or downloadable fill reports to quantify slippage over time (regulatory best-execution frameworks emphasize measuring realized outcomes; see FCA thematic materials and market discussions on implicit costs (FCA 2014 review; 2025 consultation coverage)).
• Holiday calendars and triple-day schedules that modify daily financing (FOREX.com – Rollover notes).
FAQs
Conclusion
Your FX “all-in” cost equals effective spread + swaps/rollover + commissions (+ slippage). The mix that’s cheapest for you depends on holding period, pair, session, and execution quality. Build a simple model: convert commissions to pips, track realized slippage, and pull your broker’s daily long/short funding rates—then choose the account model and trading window that minimize costs for your strategy. When in doubt, compare spot against forwards/futures if you’re hedging or carrying. Mastering these components won’t just clean up your trade diary—it can flip marginal setups from red to green.
Optimize Your Trading Costs with FBS →